|
(Note that risk tolerance is defined as your maximum acceptable value for standard deviation.)
Here are three things you should verify.
For (1) and (2), start with a portfolio that includes stocks, bonds and cash.
-
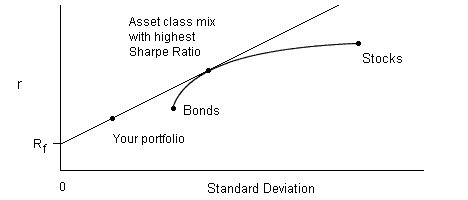
If you lower your risk tolerance level, the allocation ratio of stocks-to-bonds will remain constant, and the amount of cash will increase.
(Graphically, you're on the straight line joining cash to the Efficient Frontier, and moving to the left.)

-
If you decrease the covariance between stocks and bonds, you can allocate more money to stocks and bonds and less to cash, thus raising your rate of return.
(This is taking advantage of the curved shape of the Efficient Frontier, stretching it further to the left and tilting the line up.
By the way, this demo only lets you decrease covariance to zero, although negative covariance is possible, at least in theory.
The size of the covariance will be on a scale roughly equal to the product of the two standard deviations;
so for example, if the two investments have standard deviations of 15% and 7%, a large value for the covariance would be .15 x .07 = 0.0105.)
-
If you increase your risk tolerance to a high enough level, you'll get a zero-cash portfolio.
This means you're up on the Efficient Frontier, but to the right of the point where it intersects the straight line.
(In theory you could get up to the line even here if you are willing to hold a "negative" amount of cash, that is, to invest on margin.)
Next:
how index investing makes it easier to find the maximum Sharpe Ratio.
|