Fama and French Three Factor Model
CAPM uses a single factor, beta, to compare a portfolio with the market as a whole.
But more generally, you can add factors to a regression model to give a better r-squared fit.
The best known approach like this is the three factor model developed by Gene Fama and Ken French.
Fama and French started with the observation that two classes of stocks have tended to do better than the market as a whole: (i) small caps and (ii) stocks with a high book-value-to-price ratio (customarily called "value" stocks; their opposites are called "growth" stocks).
They then added two factors to CAPM to reflect a portfolio's exposure to these two classes:
r - Rf = beta3 x ( Km - Rf ) + bs x SMB + bv x HML + alpha
Here r is the portfolio's return rate, Rf is the risk-free return rate, and Km is the return of the whole stock market.
The "three factor" beta is analogous to the classical beta but not equal to it, since there are now two additional factors to do some of the work.
SMB and HML stand for "small [cap] minus big" and "high [book/price] minus low";
they measure the historic excess returns of small caps and "value" stocks over the market as a whole.
By the way SMB and HML are defined, the corresponding coefficients bs and bv take values on a scale of roughly 0 to 1:
bs = 1 would be a small cap portfolio, bs = 0 would be large cap, bv = 1 would be a portfolio with a high book/price ratio, etc.
One thing that's interesting is that Fama and French still see high returns as a reward for taking on high risk;
in particular that means that if returns increase with book/price, then stocks with a high book/price ratio must be more risky than average - exactly the opposite of what a traditional business analyst would tell you.
The difference comes from whether you believe in the efficient market theory.
The business analyst doesn't believe it, so he would say high book/price indicates a buying opportunity: the stock looks cheap.
But if you do believe in EMT then you believe cheap stocks can only be cheap for a good reason, namely that investors think they're risky...
Fama and French aren't particular about why book/price measures risk, although they and others have suggested some possible reasons.
For example, high book/price could mean a stock is "distressed", temporarily selling low because future earnings look doubtful.
Or, it could mean a stock is capital intensive, making it generally more vulnerable to low earnings during slow economic times.
Those both sound plausible; but they seem to be describing completely different situations (and what happens when a company that isn't capital intensive becomes "distressed"?)
It may be that the success of this model at explaining past performance isn't due to the significance of any of the three factors taken separately, but in their being different enough that taken together they do an effective job of "spanning the dimensions" of the market.
(There's actually another interpretation that's so much less cerebral that it's probably correct.
The broad market index weights stocks according to their market capitalization, making it size-biased and valuation blind;
so maybe the extra two factors in this model are just a couple of tweaks to adjust for these two problems.
This also explains why momentum is sometimes used as yet another factor: market capitalization shows where the market has been putting its money for years, while momentum shows where it has been putting it lately; so if you want to take advantage of market efficiency you start with the index and then tweak it a little with momentum.)
Portfolio Analysis
Like CAPM, the Fama and French model is used to explain the performance of portfolios via linear regression;
only now the two extra factors give you two additional axes, so instead of a simple line the regression is a big flat thing that lives in the fourth dimension.
[graphic unavailable!]
Even though you can't visualize this regression, you can still solve for its coefficients in a spreadsheet.
The result is typically a better fit to the data points than you get with CAPM, with an r-squared in the mid-ninety percent range instead of the mid eighties.
Investing for the Future
Analysing the past is a job for academics; most people are more interested in investing intelligently for the future.
Here the approach is to use software tools and/or professional advice to find the exposure to the three factors that's appropriate for you, and then to invest in special index funds that are designed to deliver that level of the factors.
You can try this tool on another website.
When you try it you should note that it in fact collapses all risk to the single factor of volatility, which is typical, and which brings up the earlier question of whether the additional factors really are measures of risk.
In this case, how would you ever help somebody figure out what their "value tolerance" was?
As a matter of fact, what would that question even mean?
Conclusions
There are two separate messages to take away from this.
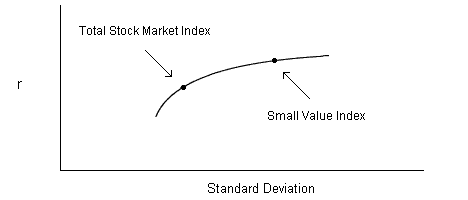
First, the three factors together account for practically all of a portfolio's behavior; that's the strongest evidence yet that mutual funds can't beat indexes.
Second, history indicates that small value "just happens" to deliver higher returns and higher volatility than the stock market as a whole.
Assuming the trend holds, then that's the practical message for investors.
In particular, it improves what felt like a flaw in the Tobin argument: where Tobin said high-risk investors should buy the total stock market index on margin, Fama and French offer the saner alternative of just adding some small value to your portfolio.
(Also see the portfolio guidelines page in the index funds article for a calculator that uses Fama and French performance data.)
Next:
insurance analogy.
|