Index Styles: Large Caps, Small Caps
Indexes typically categorize companies by their "size", meaning their market capitalization.
This diagram shows how three index families, from Standard & Poor's, The Frank Russell Company, and Wilshire Associates, divide up the market.
The "percent" numbers are the percent of the total capitalization of the U.S. stock market that each index covers;
the shaded areas represent the companies each index family omits entirely.
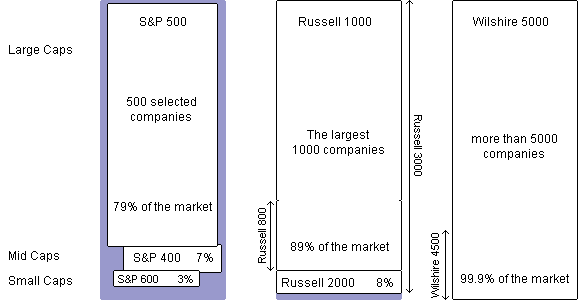
(The Russell 3000 is the Russell 1000 plus the Russell 2000; the Russell 800, which is their mid-cap index, is the 800 smallest companies within the Russell 1000.
The Wilshire 4500 is the Wilshire 5000 minus the S&P 500.)
Note how few companies it takes to make up the bulk of the market.
The difference between the Russell 3000 and the Wilshire 5000 is thousands of companies - but they're so small that taken together they only add up to about two or three percent of the total market (that's the small shaded area left over at the bottom of the Russell diagram).
Both of these indexes are known as Total Stock Market indexes, or TSM for short.
Also note what a puny little sliver the typical small cap index represents.
Not that there's anything wrong with that... except that one of the advantages of index investing is that it lets you invest in a broad section of the market, and if you choose an extreme weighting toward small caps you'll be missing out.
Value, Growth
Index families also categorize companies by valuation, as well as size.
This is typically done by taking a simple valuation measure, like the price-to-book ratio, and then setting it at a cutoff level so that it divides the index into two halves of equal market capitalization.
 The cheap half is called the "value" index, and the expensive half is called the "growth" index.
(Note that those names are euphemisms: there's no guarantee that cheap companies are really valuable, or that expensive companies will really grow.)
The cheap half is called the "value" index, and the expensive half is called the "growth" index.
(Note that those names are euphemisms: there's no guarantee that cheap companies are really valuable, or that expensive companies will really grow.)
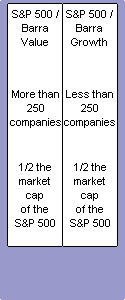
Let's take a concrete example, shown in the diagram on the left.
The grand-daddy of value indexes, once tracked by a Vanguard fund, was known as the S&P 500 / Barra Value index.
That's the index that Barra created by taking the stocks in the S&P 500 and then separating them into equal halves based on their price-to-book ratios.
Wilshire creates its value and growth indexes in a similar way -
separating companies into two mutually exclusive lists of equal market capitalization -
but they use price-to-projected-earnings as well as price-to-book to make the split.
Russell does something more complicated.
They use price/book and projected growth rates to classify companies in a way that's "additive" rather than mutually exclusive:
if they determine that a company is 60% value-like and 40% growth-like, then 60% of its market capitalization will be included in their value index and 40% will be included in their growth index.
(See this summary of Some Value Families for more specific information on the different value/growth methodologies.)
|
Still More Index Families
People have devised many other ways to slice up the market.
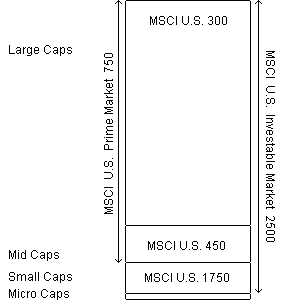
In 2003, several Vanguard funds switched from S&P / Barra and began tracking indexes from Morgan Stanley Capital International.
MSCI's division resembles a more complex version of Russell:
indexes are engineered to reduce the number of companies drifting from one box to another over time.
That should result in lower transaction costs and greater tax efficiency.
|
|
Morningstar offers an index family that divides the market into mutually exclusive pieces based on a
ten factor methodology.
What's particularly interesting about this family is that they divide the value dimension into three sections (value, "core", and growth) rather than two, and use price/earnings as the primary factor in defining value;
the result is that their value indexes tend to have lower P/E ratios than other index families.
|
|
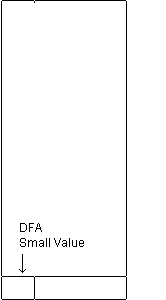
Dimensional Fund Advisors offers a family of index funds that are respected by experts but not generally available in a direct low-fee way to the public.
DFA's methodology is based on the research of Fama and French, who have studied the high returns of small value stocks, with value being defined in terms of the price-to-book ratio alone.
Consequently, their value indexes have the lowest P/B ratios available, and their small-cap offerings are really small.
|
|
|
|
|
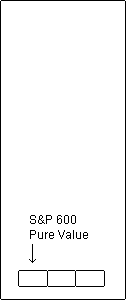
Finally (for now), in 2005 S&P announced that they would offer new style indexes as an alternative to the styles Barra had been creating for them.
Where the Barra styles were simple (a 50/50 value/growth split based on P/B), S&P will offer two splits:
regular (overlapping like Russell) and "pure" (3-way like Morningstar), based on four factors (P/B, P/Cash flow, P/Sales, P/Dividend).
Moreover, the "pure" styles will be "style weighted" rather than market cap weighted, which should be interesting...
(Do you think we have enough choices yet?)
|
|